Running a Validator on the Mainnet
To participate in the NPoS consensus protocol for the Analog Network, you must deploy and run a validator and, optionally, a Timechain full node. The Analog Main-net commenced a soft launch on December 23, 2024, initially operating with a select group of authorized validators.
This controlled phase will precede the official launch, marked by the Token Generation Event (TGE) on January 15, 2025. The network is designed to evolve gradually towards a decentralized model, featuring validator selection through a Nominated Proof-of-Stake (NPoS) mechanism and governance entirely driven by on-chain token voting. For more details, see Decentralization Roadmap.
This section outlines the detailed steps for installing, running, and maintaining a validator on the Analog Main-net.
Prerequisites
See Requirements for more details.
Getting Started
You can install and run the Timechain Node using any of these three options:
Option 1: Running pre-built Docker Image
Prerequisites
- Docker or Podman installed on your machine.
- Minimum bond amount of $ANLOG tokens (check the current requirement here ).
Step 1: Install and Run the Timechain Node
1.1 Pull the Docker Image
docker pull analoglabs/timenode-prod:latestIf you are using Podman, just run:
podman pull docker.io/analoglabs/timenode-prod:latest1.2 Start the Node
Run the following command to start your validator node:
docker run -d -p 30333:30333 -p 9944:9944 \
-v  /path/to/data:/root/.local/share/timechain-node/ analoglabs/timenode-prod:latest \
--name 'INSERT_YOUR_NODE_NAME' rotateKeys --validator \
--unsafe-rpc-external \
--rpc-methods=unsafe
Key Flags Explained:
-v /path/to/data:...: Persists chain data to the host directory (/path/to/data). Replace this with your preferred path.--name: Sets your node’s display name on Analog Telemetry .--unsafe-rpc-externaland--rpc-methods=unsafe: Enable RPC interactions (use only in secure environments).
Step 2: Sync Chain Data
Your node will sync the full chain history by default. To use Warp Sync (faster), add --sync=warp to the command in Step 1.2:
- "--port=30333"
- "--rpc-port=9933"
...
- "--sync=warp"
Example command with Warp Sync enabled:
docker run -d -p 30333:30333 -p 9944:9944 \
-v  /path/to/data:/root/.local/share/timechain-node/ analoglabs/timenode-prod:latest \
--name 'INSERT_YOUR_NODE_NAME' rotateKeys --validator \
--unsafe-rpc-external \
--rpc-methods=unsafe
--sync=warp
Wait until your node is fully synced. Monitor progress via logs:
docker logs -f [CONTAINER_ID]Step 3: Bond $ANLOG Tokens
After syncing, bond $ANLOG tokens to activate your validator:
- Go to Polkadot.js Apps and connect to Analog Timechain:
- Navigate to Network>Staking > Account Actions.
- Click + Stash:
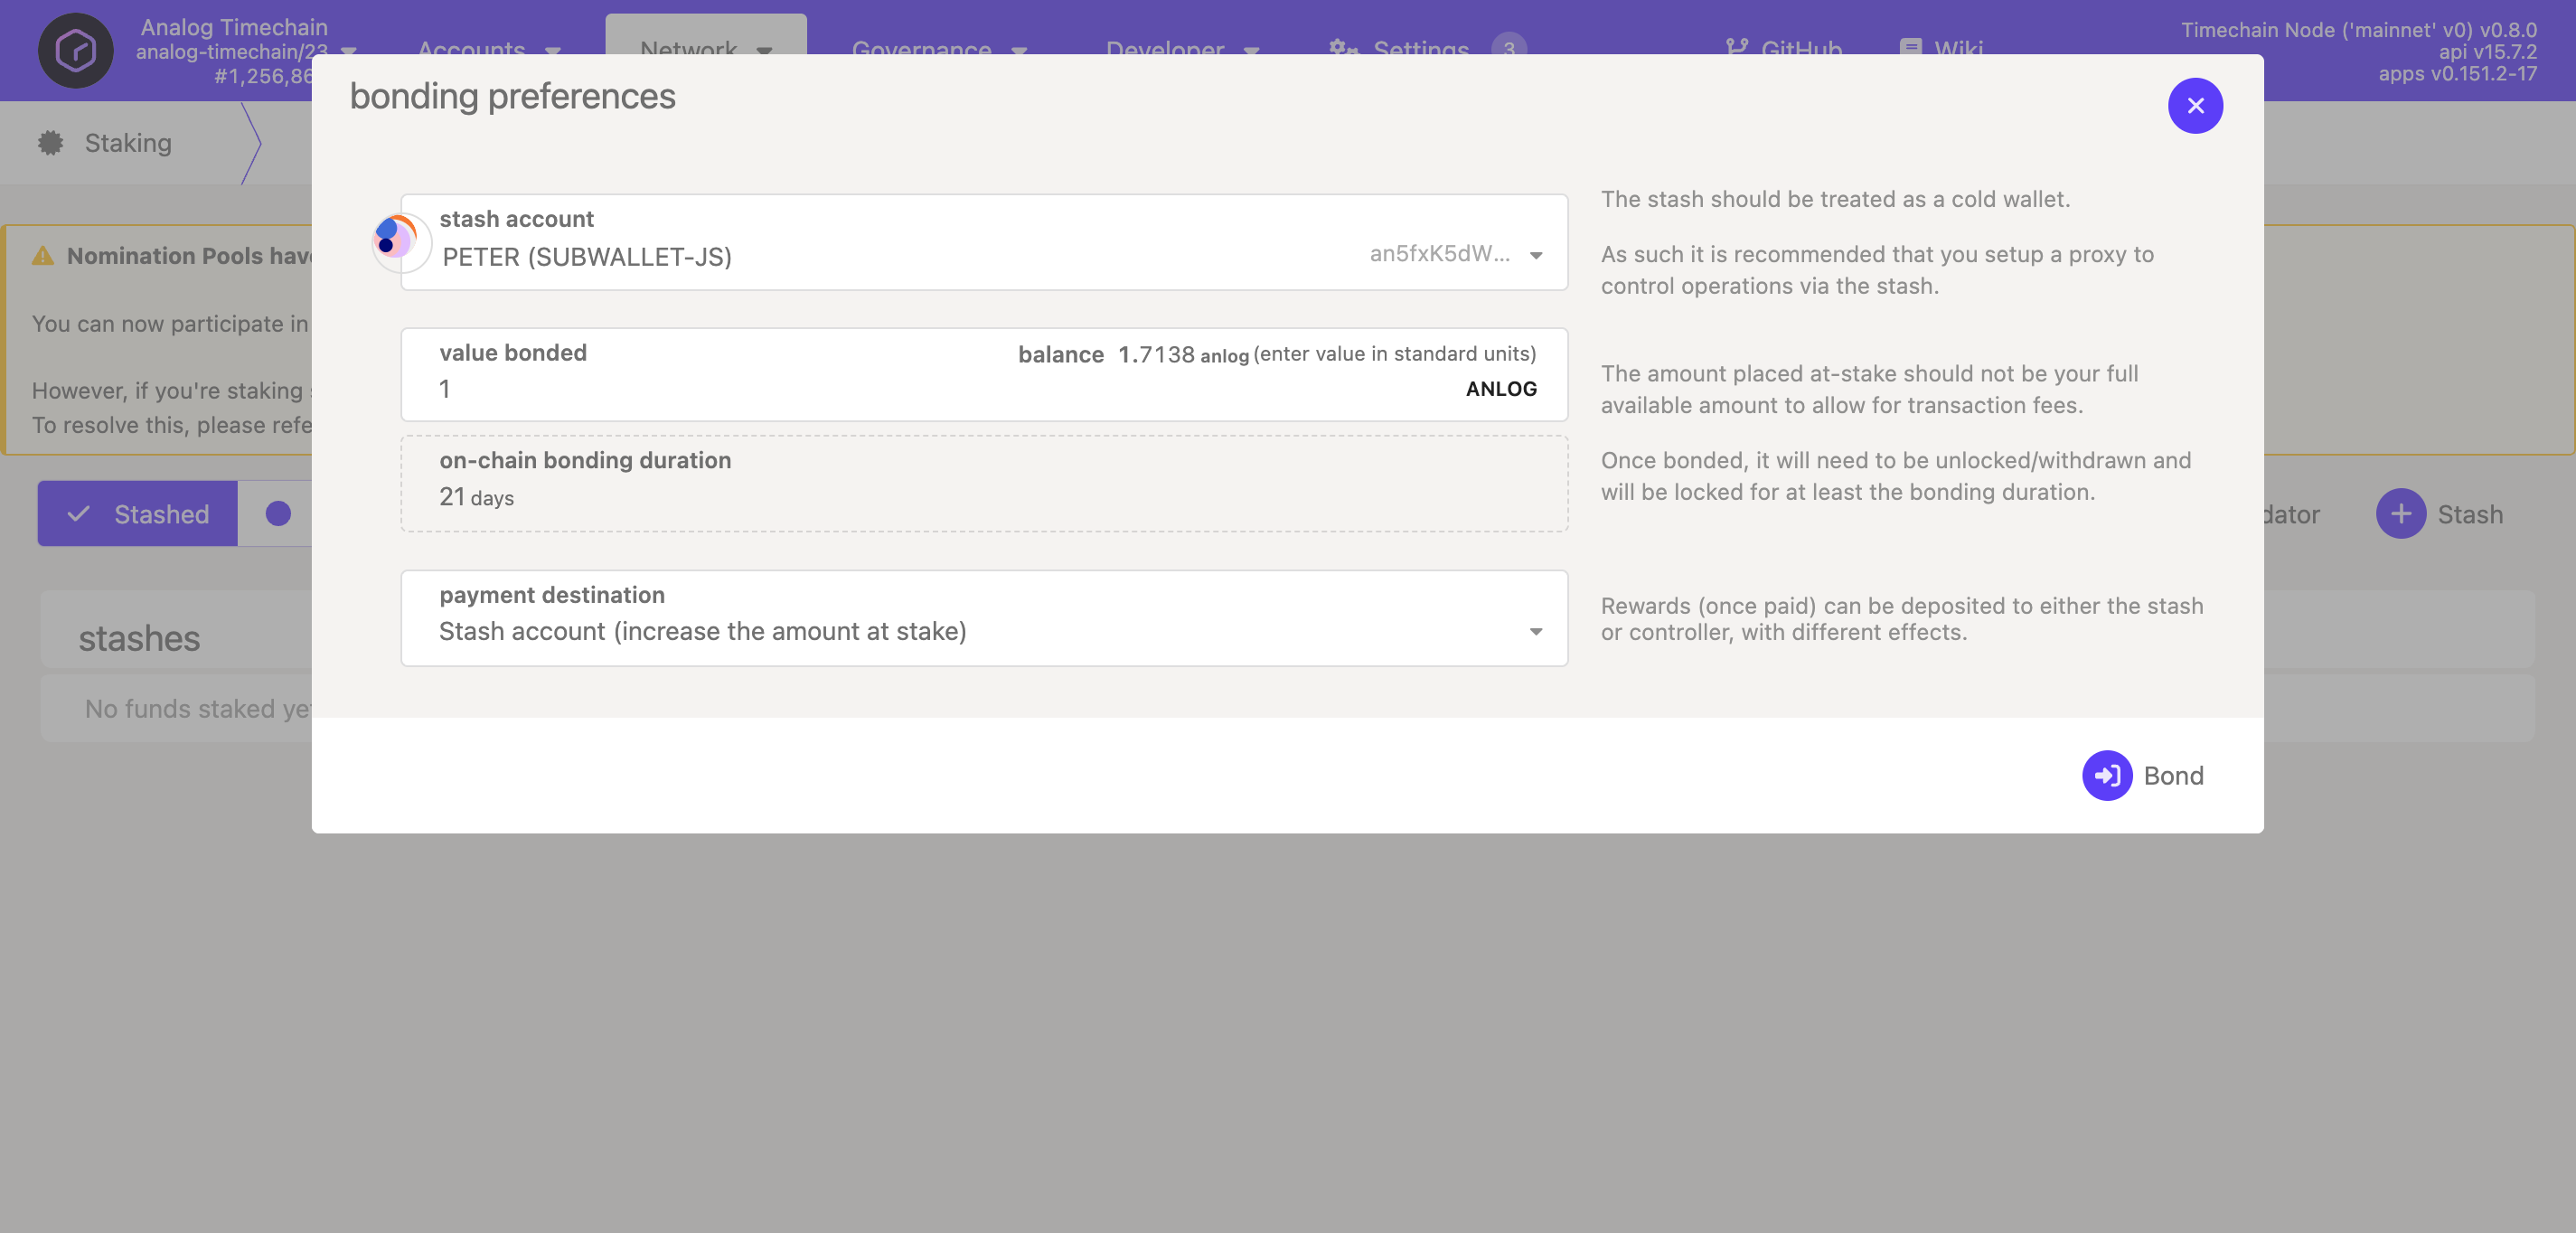
- In the modal window:
- Select your Stash account (the account with your $ANLOG tokens)
- Enter the amount to bond in the Value bonded field
- Choose your Payment destination for staking rewards
- Submit the transaction and sign with your wallet.
Step 4: Set Session Keys
Session keys link your node to your controller account:
4.1 Generate Keys
Call the RPC method author_rotateKeys on your running node:
echo '{"id":1,"jsonrpc":"2.0","method":"author_rotateKeys","params":[]}' | websocat -n1 -B 99999999 ws://127.0.0.1:9944This returns a hex-encoded key string (e.g., {"jsonrpc":"2.0","result":"0x0cef998a81357e73e79e2ed98e1d3ff81dfabf55444c14e3291ca9beaebfe9754483d09abf1021358280713b90fb96497ac6a2f22575f8421ffd7287fc1225440e521f344f34afc396bd4ee26164ce1962957d2a553f0d968a02068863c08375","id":1})
The string is the concatenation of the three public keys. Save this result for a later step. If you do not have Websocat installed, read this article to learn more about how to install it.
4.2 Submit Keys via Polkadot.js
- Go to Network>Staking > Accounts Actions.
- Click on Set Session Key for the bonding account you set earlier.
- Paste the key string from Step 4.1.
- Submit the transaction.
Your node is now registered as a validator candidate.
Step 5: Verify Node on Telemetry
Check if your node is active on the network:
- Visit Analog Telemetry .
- Search for your node name (set via
--namein Step 1.2). - Confirm it shows as "Active" under the validator list.
Step 6: Monitor Your Validator
To monitor detailed metrics (CPU, memory usage, chain height, peer count), use Prometheus and Grafana:
Prometheus Setup:
- Install Prometheus (official docs ).
- Add the flag
--prometheus-externalto your Docker command to expose metrics on port9615. - Configure
prometheus.ymlwith targets pointing to your Analog node metrics endpoint.
Example configuration snippet:
scrape_configs:
  - job_name: 'analog-validator'
    static_configs:
      - targets: ['localhost:9615']
Grafana Setup:
- Install Grafana (official docs ).
- Add Prometheus as data source in Grafana:
- Navigate to Settings > Data Sources > Add Data Source.
- Select Prometheus; set URL (
http://localhost:9090)
- Click Save & Test
Support
Contact technical support on Discord and share your feedback.