Running a Full Node on the Mainnet
The Analog Mainnet commenced a soft launch on December 23, 2024, initially operating with a select group of authorized validators. This controlled phase will precede the official launch, marked by the Token Generation Event (TGE) on January 15, 2025.
The network is designed to evolve gradually towards a decentralized model, featuring validator selection through a Nominated Proof-of-Stake (NPoS) mechanism and governance entirely driven by on-chain token voting. For more details, see Decentralization Roadmap.
This section explains how to install the full node on the Analog Main-net Beta Release.
Getting Started
You can install and run a full node using any of these three options:
Option 1: Running pre-built Docker Image
Prerequisites
- Docker or Podman installed on your machine.
- Minimum hardware requirements
1. Install the Timechain Node Image
Pull the latest Timechain image from DockerHub:
- If you are using Docker, run:
docker pull analoglabs/timenode-prod:latest- If you are using Podman, just run:
podman pull docker.io/analoglabs/timenode-prod:latest2. Run the Timechain Node
Use this command to start the node:
docker run -p 9944:9944 -p 9615:9615 \
  -v /path/to/data:/root/.local/share/timechain-node/ \
  analoglabs/timenode-prod:latest \
  --name 'YOUR_NODE_NAME' \
  --rpc-external \
  --prometheus-external
Flags Explained:
-v /path/to/data:...: Persists chain data to your local directory. Replace/path/to/datawith your preferred storage path.--name: Assign a unique name (e.g.,analog_node_01) for identification on Analog Telemetry .--rpc-external: Enables external access to the RPC server.--prometheus-external: Exposes metrics for monitoring.
When running the Timechain Node in Docker, it listens only on localhost by default. To enable external connections for services like RPC and Prometheus, use the --rpc-external and --prometheus-external flags. For interface details, consult the built-in help (--help) or the official documentation for flags , options , and subcommands .
3. Sync Chain Data
The node will automatically start syncing with the network as shown here:
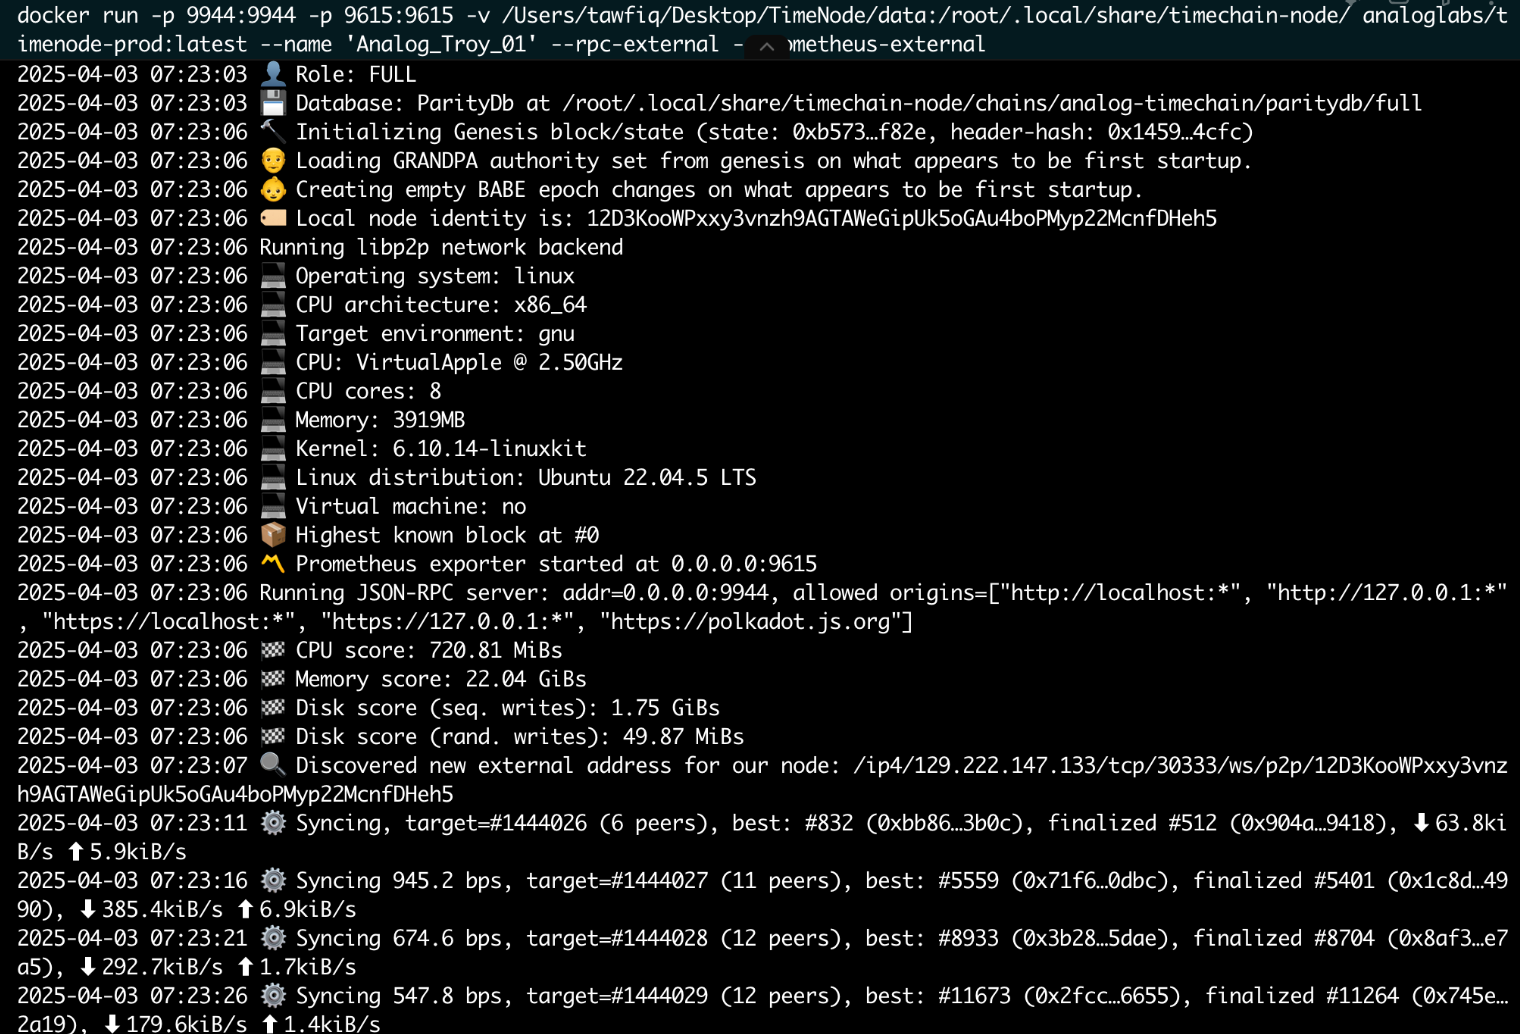
This process may take several hours, depending on the network bandwidth and your hardware.
To check sync progress:
docker logs --tail 100 [CONTAINER_ID] | grep "Syncing" Replace [CONTAINER_ID] with your container’s ID (find it using docker ps).
4. Configure RPC Settings
Customize RPC access using these flags in your docker run command:
| Flag | Purpose | Example |
|---|---|---|
--rpc-methods | Restrict RPC methods | --rpc-methods safe |
--rpc-max-connections | Limit connections | --rpc-max-connections 100 |
--rpc-cors | Manage access control | --rpc-cors all (allow all domains) |
For advanced configurations, refer to the RPC documentation .
5. Verify Node Operation
Check Node Status
- Logs:
docker logs -f [CONTAINER_ID] - RPC Endpoint:
Test your node's RPC endpoint by sending a request:
curl -H "Content-Type: application/json" -d '{"id":1, "jsonrpc":"2.0", "method":"system_health"}' http://localhost:9944A successful response indicates your node is operational.
6. Monitor Node Metrics
Setting Up Prometheus
- Create a
prometheus.ymlconfiguration file:
global:
  scrape_interval: 15s
scrape_configs:
  - job_name: 'analog_node'
    static_configs:
- targets: ['localhost:9615']- Restart Prometheus.
- Run Prometheus with Docker:
docker run -d -p 9090:9090 -v /path/to/prometheus.yml:/etc/prometheus/prometheus.yml prom/prometheusSetting Up Grafana
- Run Grafana with Docker:
docker run -d -p 3000:3000 grafana/grafana- Access Grafana at
http://localhost:3000 - Add Prometheus as a data source:
- Go to Configuration > Data Sources
- Add Prometheus with URL
http://localhost:9090 - Click "Save & Test."
- Import a dashboard for node monitoring:
- Go to Dashboards > Import
- Import a Substrate/Polkadot dashboard (you can find templates on Grafana's website).
Support
Contact technical support on Discord and share your feedback.